
Warner Robins, GA Real Estate Snapshot | November 2025: Big Inventory, Balanced Demand, and Strong Buyer Diversity
Warner Robins is always the engine of Houston County’s real estate activity, and November confirmed that once again. With the largest inventory in the region, this market didn’t behave like Perry, Bonaire, or Byron. Instead, Warner Robins presented something rare: a nearly perfect balance between what buyers are paying and what sellers are listing.
But beneath that balance is a deeper truth:
Affordable homes are moving fast, mid-range homes are moving steadily, and homes priced too high for their neighborhood are lingering.
Warner Robins isn’t one market, it’s a set of four micro-markets, each responding differently to pricing, condition, and demand.
Here’s the full breakdown.
📊 November 2025 Snapshot
(Central Georgia MLS)
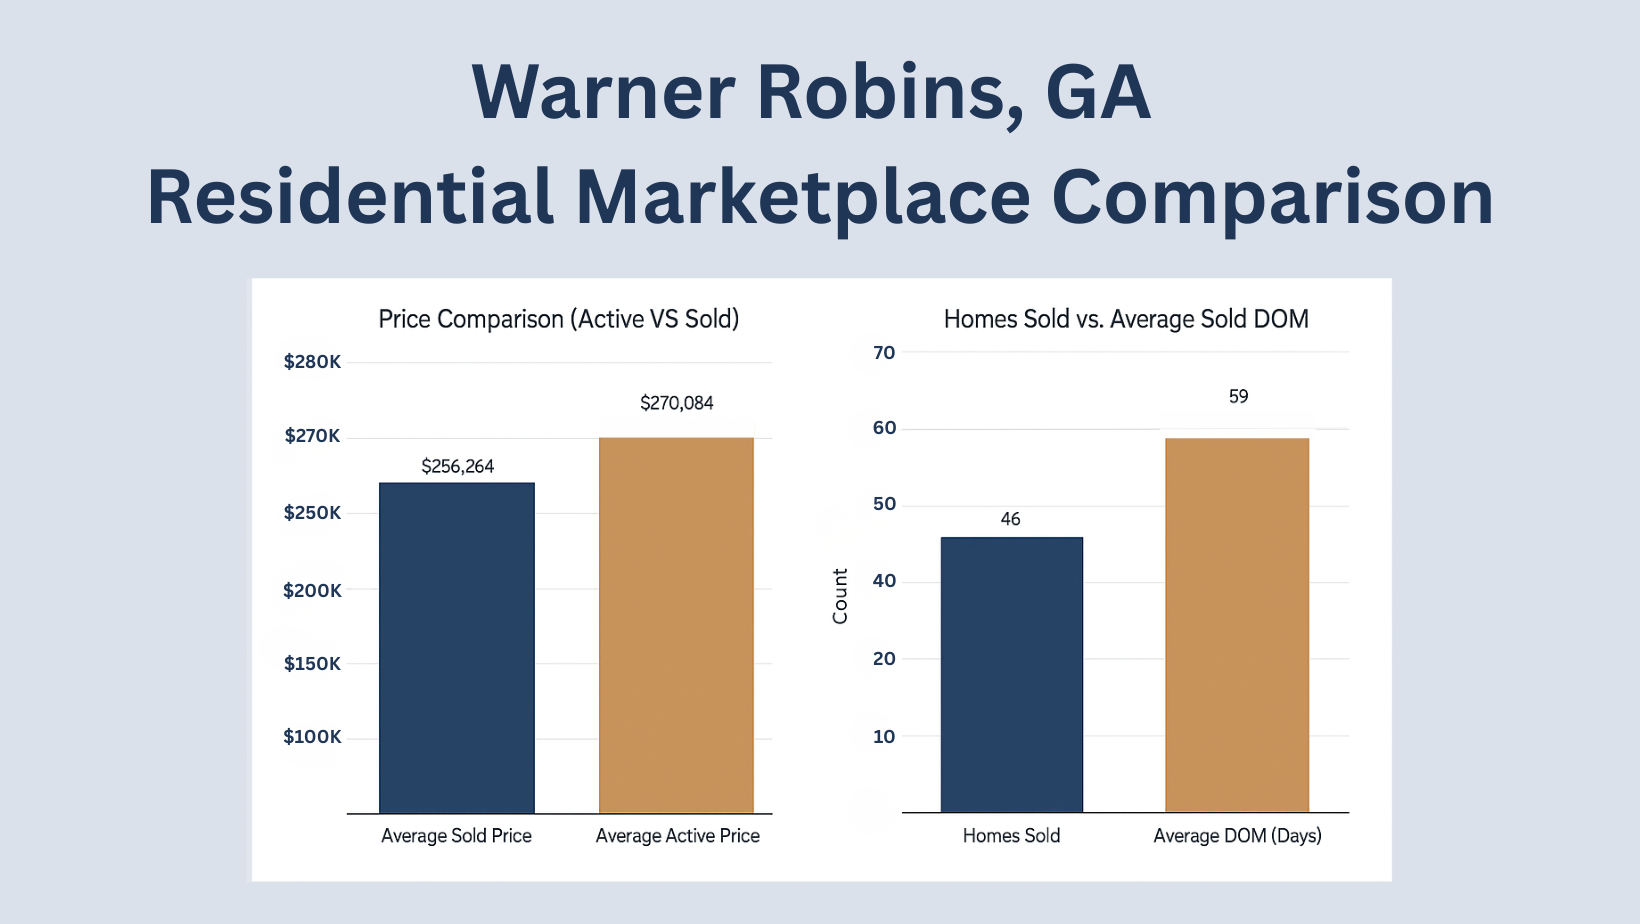
• 46 homes sold
• $11,788,155 in total sold volume
• Average Sold Price: $256,264
• Average Sold DOM: 59 days
Warner Robins real estate shows steady absorption and consistent movement across the middle price ranges. The mid-$200s remain the heartbeat of the city.
📌 Active Inventory Snapshot – Real-Time Market Pressure
As of November’s active report:
• 193 active listings
• $52,126,242 in active volume
• Average Active Price: $270,084
• Average Active DOM: 61 days
⭐ Unique to Warner Robins:
The gap between SOLD DOM (59 days) and ACTIVE DOM (61 days) is extremely narrow.
That means:
• Buyers are not rejecting pricing across the board
• But they are rejecting pricing in specific neighborhoods and price tiers
• This is a balanced market, not overpriced, not undervalued
Where other Middle GA markets have a sharp ACTIVE vs SOLD pricing disconnect, Warner Robins is more aligned, but segmented internally.
📍 Neighborhood / Micro-Market Performance (The Real Warner Robins Real Estate Story)
Warner Robins is four distinct submarkets, each behaving differently.
Watson Blvd North
• Active Avg Price: $219,089
• Sold Avg Price: $271,521
• Active DOM: 54
• Sold DOM: 116
Interpretation:
This area has aging inventory, condition issues, and homes that need updating.
Updated homes sold at much higher prices, but took longer due to appraisal/repair cycles.
Watson Blvd South → Hwy 96 (Largest Submarket)
• Active Avg Price: $327,194
• Sold Avg Price: $256,418
• Active DOM: 65
• Sold DOM: 34
Interpretation:
This is WR’s biggest pricing mismatch:
Active listings are $70K higher than where buyers are actually closing.
Homes priced correctly sell in ~34 days.
Homes priced too aggressively sit past 60–90 DOM.
This is the most important insight in the Warner Robins real estate market.
Hwy 96 → Mossy Creek
• Smaller sample, but consistent
• Average pricing near $370K
• Buyer pool is selective but stable
• Newer homes perform best here
Perry / South Houston County Edge of WR
• Affordable
• Strong entry-level buyer pool
• Reliable movement near $220K–$250K
💳 How Buyers Are Financing Their Homes?
(Source: Central Georgia MLS)
🔎 What This Tells Us (Warner Robins real estate-specific)?
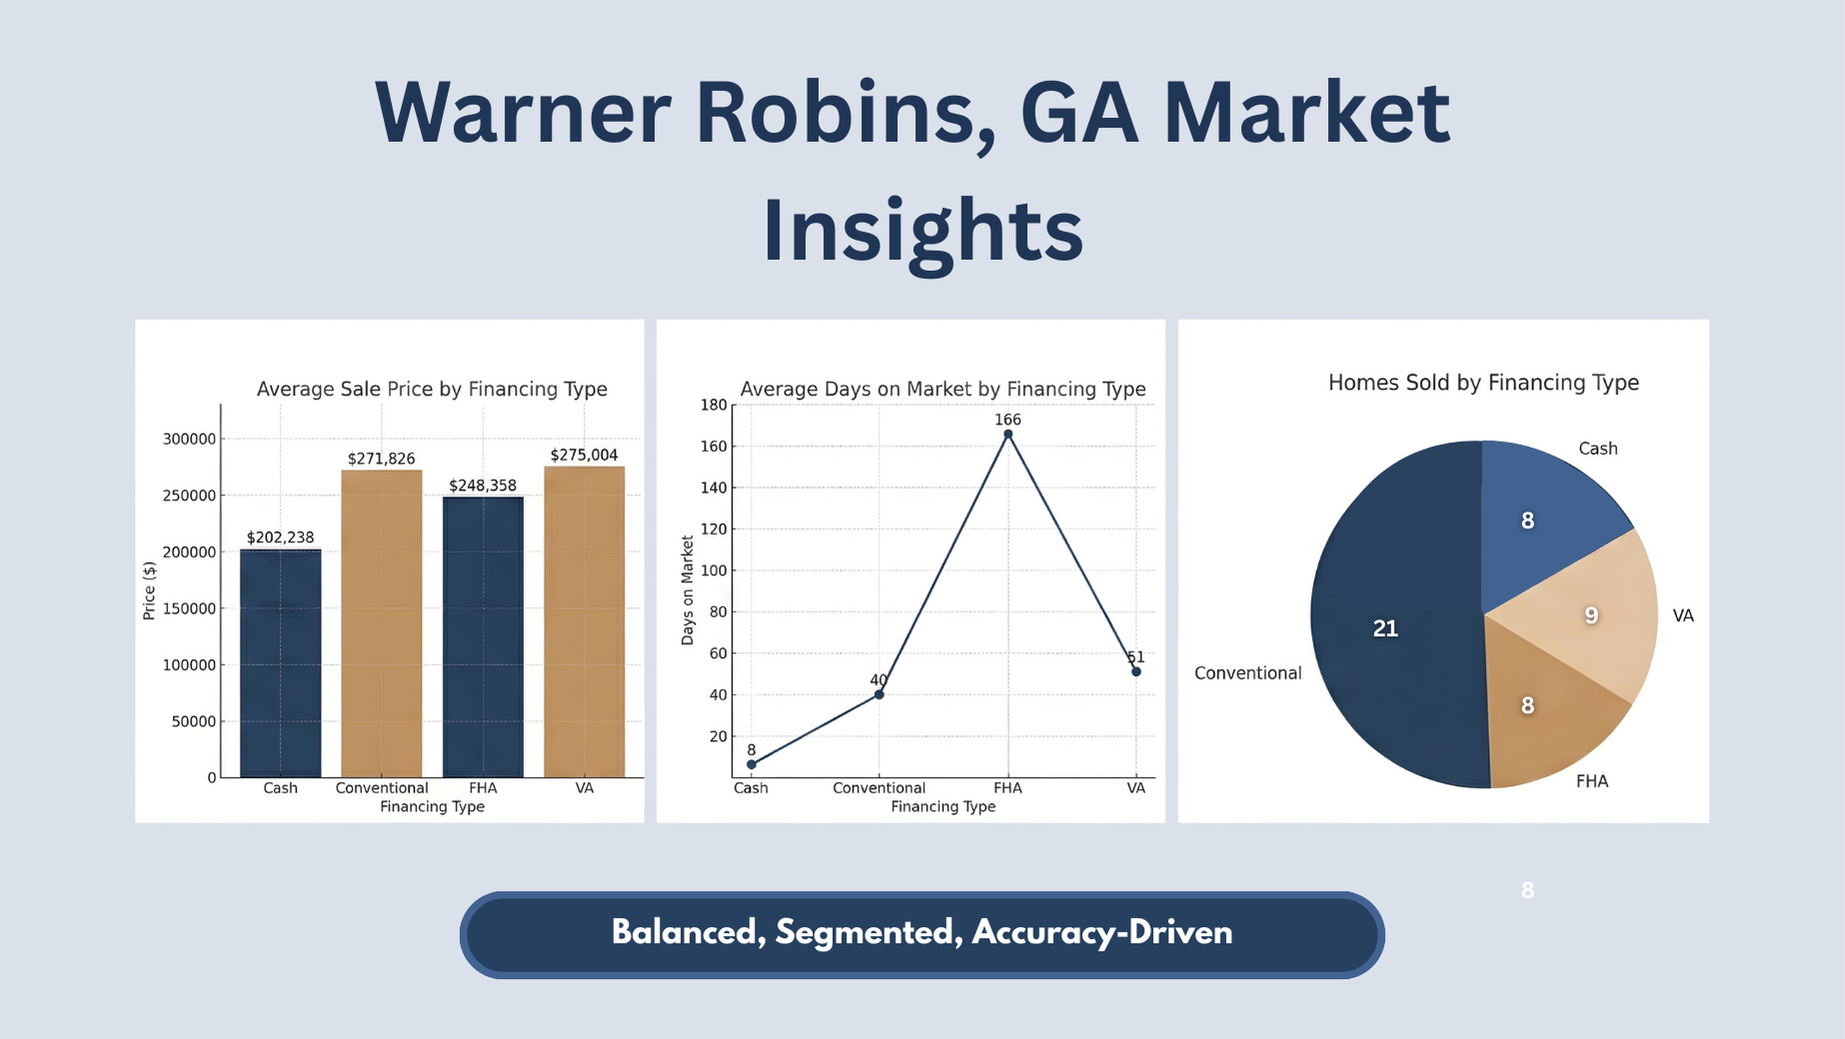
Conventional buyers drove the market (21 sales)
A clear sign that updated mid-range homes are performing best.
Conventional buyers acted quickly, especially between $240K–$290K.VA demand remains strong and stable (9 sales)
Driven by Robins Air Force Base.
VA buyers gravitated toward newer homes between $260K–$310K.
This is a foundational driver of Warner Robins’ consistency.FHA demand is solid, but DOM reflects condition challenges
FHA DOM averaged 166 days, signaling:
• Overpricing on dated homes
• Extended repairs/appraisal requirements
• Strong FHA demand when homes are move-in-ready
This is critical:
FHA buyers are active, but Warner Robins’ aging stock makes FHA closings slower.Cash buyers acted FAST (8 DOM)
Cash concentrated below $200K and in investor-friendly pockets.
This is typical of Warner Robins’ entry-level market.
💰 Where Prices Landed (Unique Warner Robins Price Behavior)?
1. Under $230K
Fastest movement
FHA + cash heavy
Strong rental and investor demand
2. $240K–$310K (Core Market)
Most consistent
Conventional + VA dominate
Move-in-ready homes shine
3. $330K–$400K+
Slower
Buyer pool narrows
Pricing varies dramatically by micro-market
Warner Robins’ diversity in home ages and neighborhoods creates multiple parallel markets, not one unified trend.
🧭 Market Feel
Warner Robins felt:
• Balanced not rushed, not sluggish
• Segmented neighborhood matters more than the citywide average
• Accurate buyers accept fair pricing
• Demand-driven especially in the mid-range
• Condition-sensitive updated homes outperform dated ones significantly
This is NOT an overheated market, and it’s NOT a soft market.
It is a normalizing, well-functioning environment.
🕰 What to Expect Heading Into December?
For Buyers:
• Strong negotiation room above $300K
• Fast movement under $230K
• Mid-range buyers can act confidently
• Larger inventory = better choice
For Sellers:
• Pricing must align with your exact neighborhood
• Updated homes stand out sharply
• Overpricing in Watson South → 96 leads to 60–120 DOM
• Present well, price well → 30–45 day absorption
🔎 The Takeaway
Warner Robins is Houston County’s most balanced market, but also its most segmented.
The numbers show:
Sold Avg Price: $256,264
Active Avg Price: $270,084
Sold DOM: 59
Active DOM: 61
The overall alignment masks a major internal divide:
Watson South-to-96 sellers are listing far above what their segment can absorb.
Why it matters?
Sellers must price with their micro-market, not the city average.
Buyers have options, and leverage in higher price tiers.
WR’s strength comes from diversity, not price inflation.
📞 Thinking About Your Next Move?
Whether you're buying, selling, relocating, or investing, I can break down your exact submarket so you can move with clarity.
William Walton-Dean | Walton Dean Realty
📱 478-371-7069
“Your dreams. Our dedication. A luxury experience tailored for you.”