
Kathleen Real Estate Snapshot | January 2026: Strong Prices, Careful Buyers, and a Market With High Standards

January in Kathleen doesn’t set trends through speed — it sets them through pricing behavior.
As the year opened, buyers returned with confidence but not urgency. Homes continued to sell at some of the highest price points in Houston County, while time on market revealed exactly where buyer expectations were met — and where sellers were testing limits.
January wasn’t about momentum.
It was about standards.
Here’s what actually happened in the Kathleen GA real estate market.
📊 January 2026 Market Snapshot
(Central Georgia MLS)
Metric January 2026
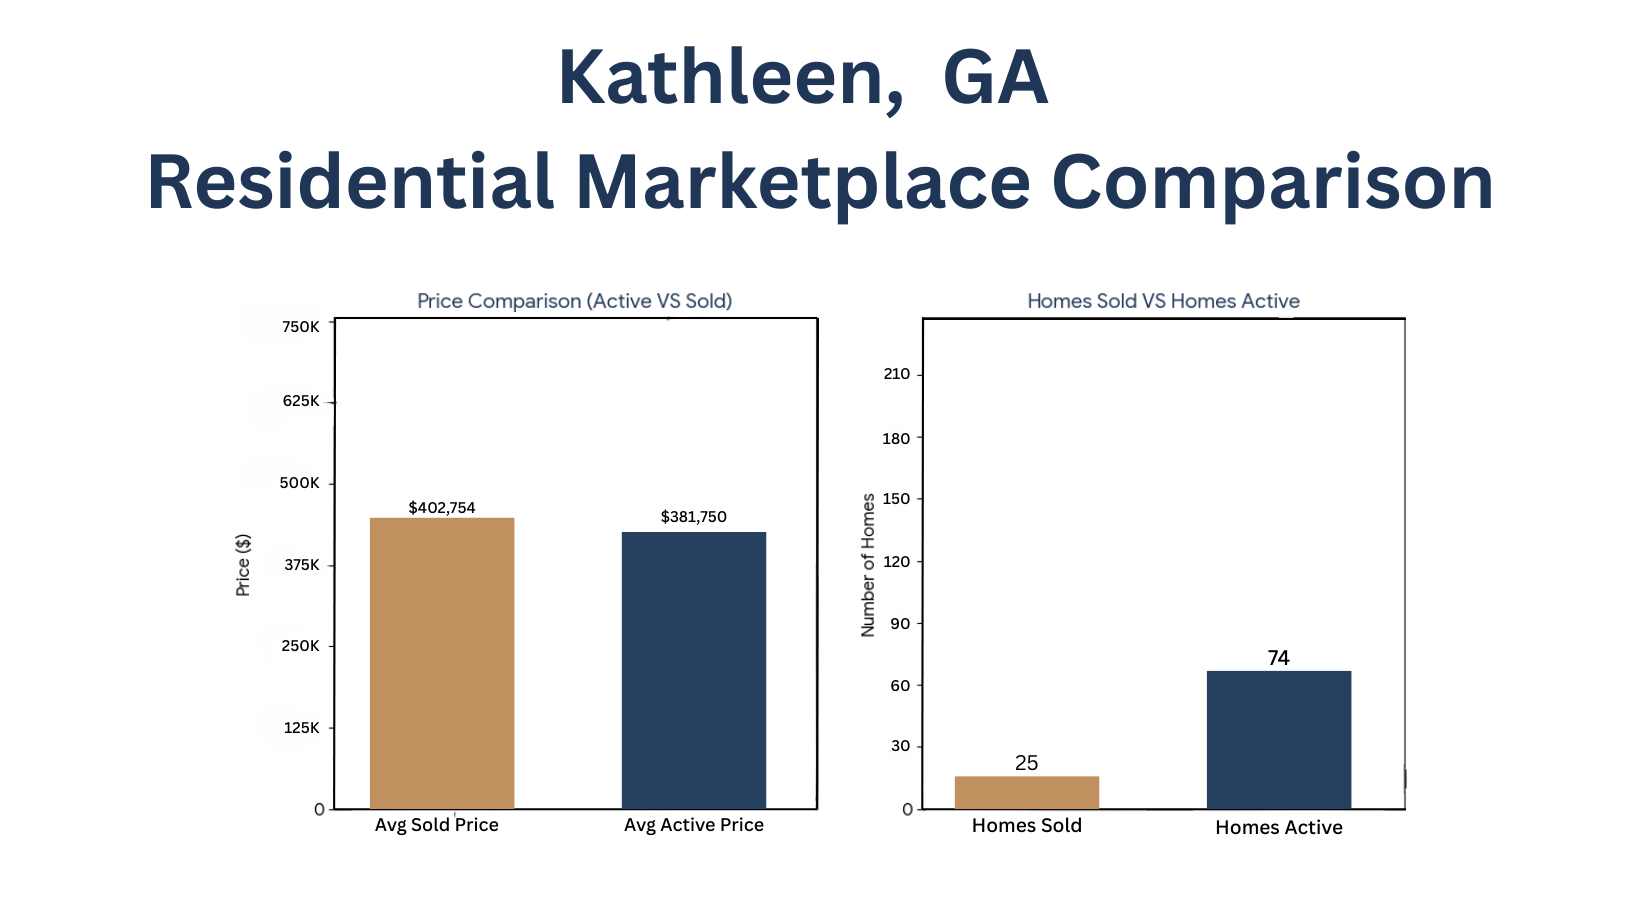
Homes Sold 25
Total Sales Volume $10,068,858
Average Sold Price $402,754
Average Sold DOM 46 days
Kathleen once again posted county-leading average prices, with homes selling just over $400K on average. A 46-day average time on market shows buyers were deliberate — not hesitant.
📌 Active Inventory Snapshot – Buyer Choice at the Top End
At the end of January, Kathleen had
Active Homes 74
Total Active Volume $28,249,508
Average Active Price $381,750
Median Active Price $339,000
Average Active DOM 85 days
Longer active DOM in Kathleen reflects buyers carefully filtering premium inventory, not stepping away from the market.
⭐ The Core Kathleen Market Insight (January)
January confirms that Kathleen is price-supported but quality-gated.
The average sold price ($402K) exceeded the average active price, showing buyers were willing to pay strong numbers — but only for homes that met expectations around layout, finishes, and location. Listings that missed those expectations accumulated time rather than forcing price cuts.
That behavior defines a mature, high-expectation market.
📍 Submarket Performance (Where Sales Actually Happened)
96 → Mossy Creek (Core Kathleen Market)
Homes Sold 23 of 25
Average Sold Price $404,733
Average DOM 47 days
This corridor continues to anchor Kathleen’s pricing power. Buyers committed at strong prices, but only after evaluation — reinforcing that this is a move-up market, not a rush market.
Perry & South Houston County Edge
Homes Sold 2
Average Sold Price $380,000
Average DOM 31 days
These sales should not be used as benchmarks for core Kathleen pricing. They represent fringe behavior, not the heart of the market.
💰 Where Prices Landed (Average Price View)
January sales in Kathleen naturally clustered into three functional tiers:
$300K–$340K
• FHA and VA buyers active
• Faster decisions
• Entry into Kathleen pricing
$350K–$420K (Market Center)
• Highest concentration of sales
• Conventional + VA dominant
• Strong alignment between price and condition
$450K+
• Fewer transactions
• Longer evaluation periods
• Performance tied directly to finish quality
Kathleen’s center of gravity remains well above the county average, but buyers are not stretching blindly.
💳 Buyer Financing Breakdown (January)
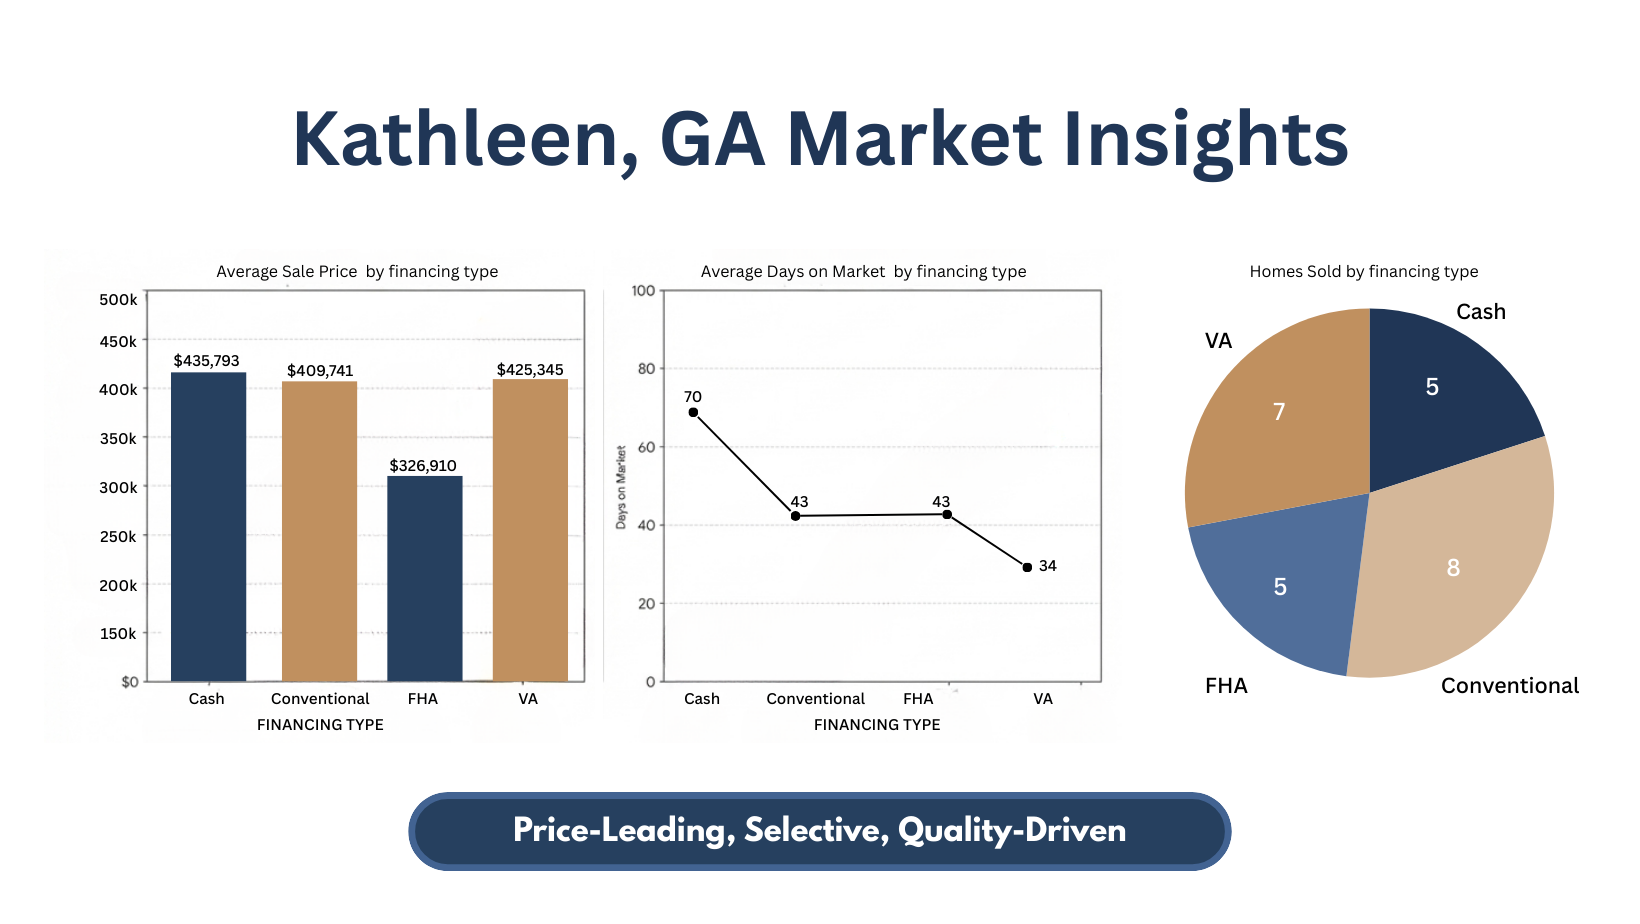
| Loan Type | Homes Sold | Avg Price | Avg DOM |
|---|---|---|---|
| VA | 7 | $425,345 | 34 |
| Conventional | 8 | $409,741 | 43 |
| FHA | 5 | $326,910 | 43 |
| Cash | 5 | $435,793 | 70 |
What this tells us:
· VA and conventional buyers support Kathleen’s upper price tiers
· FHA remains active, but concentrated below the core move-up range
· Cash is present but slower, reinforcing price discipline rather than speculation
🧭 Market Feel – January
Kathleen in January felt:
• Confident
• Selective
• Buyer-driven
• Quality-sensitive
• Resistant to broad repricing
Homes didn’t sell because inventory was tight.
They sold because buyers agreed the value was justified.
🕰 What January Signals for Kathleen in 2026
For Buyers:
• Expect choice, not pressure
• The best homes will still require decisive action
• Negotiation appears when homes miss quality benchmarks
For Sellers:
• Kathleen buyers reward preparation
• Pricing power exists — but only with alignment
• Homes priced for aspiration rather than condition will wait
For the Market:
• Kathleen remains a price leader in Houston County
• Growth will be selective and property-specific
• Stability, not speed, defines this market
🔎 The Takeaway
January didn’t soften Kathleen.
It clarified it.
| Metric | January 2026 |
|---|---|
| Homes Sold | 25 |
| Average Sold Price | $402,754 |
| Average Active Price | $381,750 |
| Average Sold DOM | 46 |
| Market Profile | Price-Leading, Selective, Quality-Driven |
This is exactly how premium suburban markets behave when they’re healthy.
📞 Thinking About Your Next Move?
If you’re buying or selling in Kathleen in 2026, understanding where your home fits inside buyer expectations matters more than watching averages alone. I’m here to break that down and help you move with clarity.
William Walton-Dean | Walton Dean Realty
📱 478-371-7069
Your dreams. Our dedication. A luxury experience tailored for you.