
Warner Robins Real Estate Market Update | January 2026: Volume Returned, Discipline Followed
January in Warner Robins doesn’t ask whether buyers are present.
It asks how they choose.
As the largest and most liquid housing market in Houston County, Warner Robins always reactivates quickly after the holidays. But January didn’t produce chaotic competition or broad price escalation. Instead, it revealed something more instructive: buyers returned with clear rules, and the market respected them.
That behavior matters, because Warner Robins often sets the tone for the rest of the county.
Here’s what January showed.
📊 January 2026 Snapshot
(Central Georgia MLS)
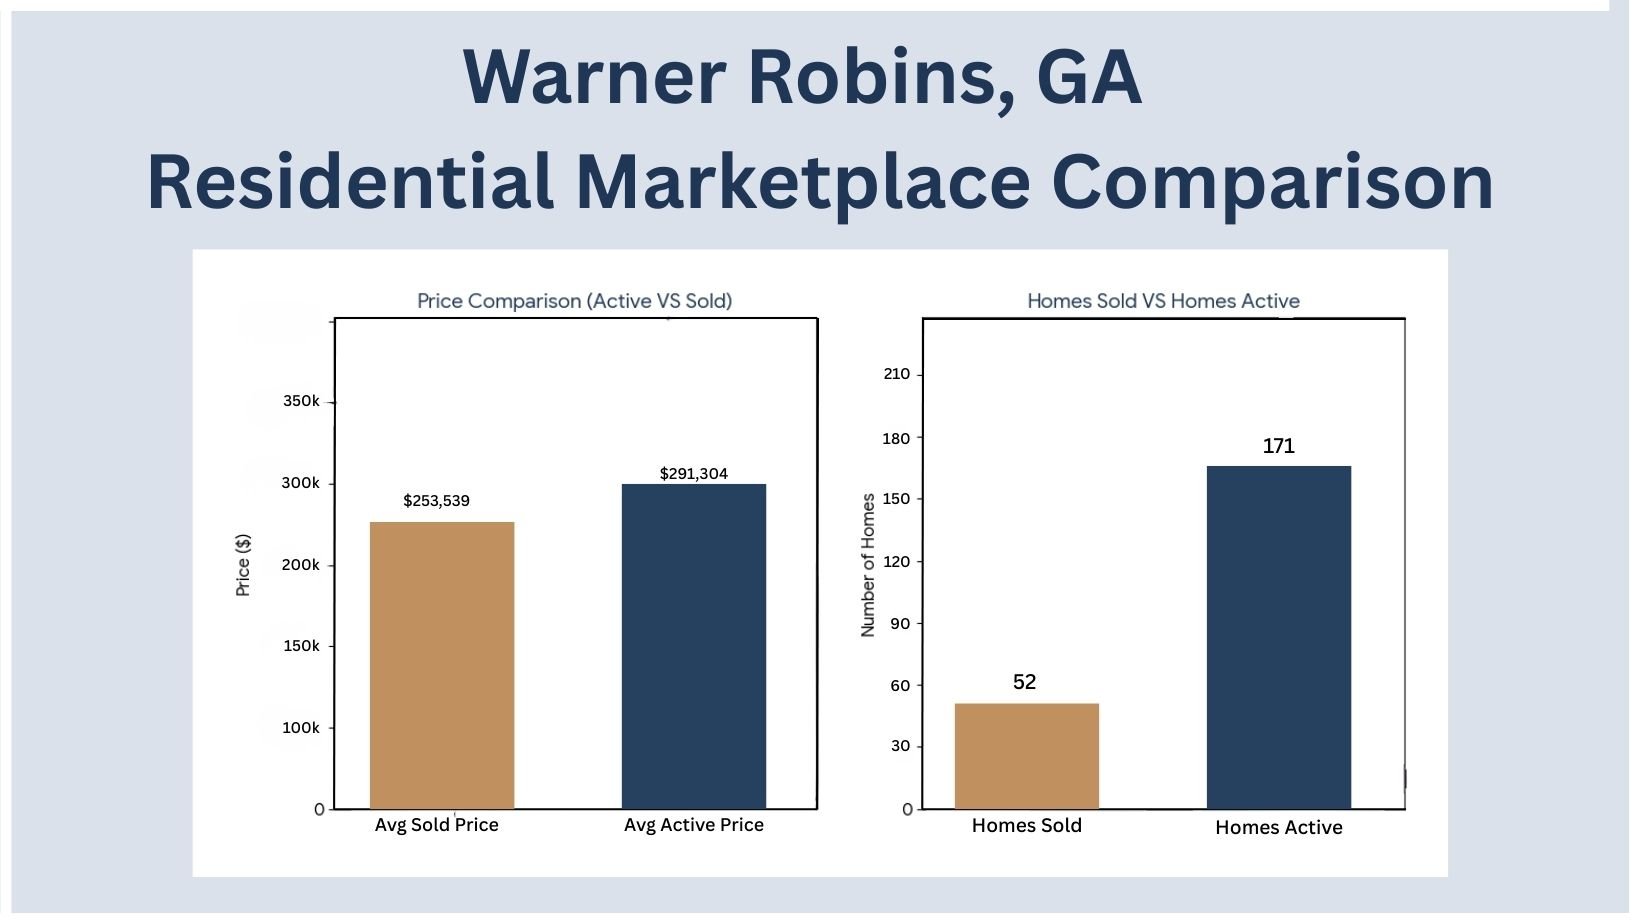
• 52 residential sales closed
• $13,184,050 total sales volume
• Average Sold Price: $253,539
• Median Sold Price: $236,000
• Average Sold DOM: 46 days
Fifty-two closings in January is not noise — it’s confirmation. Warner Robins entered 2026 with depth, liquidity, and consistent buyer participation across multiple price tiers.
📌 Inventory Scale: Choice Exists, Absorption Continues
At the end of January, Warner Robins recorded:
• 171 active single-family detached homes
• $49,813,012 in active volume
• Average Active Price: $291,304
• Median Active Price: $264,900
• Average Active DOM: 69 days
This inventory level is substantial — but not burdensome. The spread between active and sold pricing reflects evaluation, not rejection. Buyers are comparing options within neighborhoods, not abandoning the market.
This is what functional supply looks like in a large city market.
⭐ What January Clarified About Warner Robins
January reinforced Warner Robins’ defining trait: internal segmentation matters more than citywide averages.
The market did not behave as one uniform block. Instead, buyers expressed preferences clearly — by location, price band, and condition — while still transacting at scale.
This is a market that doesn’t stall. It sorts.
📍 Where Sales Concentrated (The Real Story)
Watson Blvd South → Highway 96 (Primary Engine)
• 34 of 52 January sales
• Average Sold Price: $270,181
• Median Sold Price: $260,250
• Average DOM: 41 days
This corridor remains the backbone of Warner Robins housing activity. Buyers here acted decisively when homes aligned with expectations, keeping DOM under control even with abundant options.
Watson Blvd North
• 16 sales
• Average Sold Price: $214,281
• Median Sold Price: $200,000
• Average DOM: 58 days
This area continues to reflect older housing stock and greater condition variability. Movement exists, but pricing sensitivity is more pronounced.
96 → Mossy Creek / Outliers
• Limited volume
• Higher prices, selective demand
January made it clear: Warner Robins moves through its core, not its edges.
💰 Where Buyers Drew Boundaries
January sales formed three clear functional bands:
Under $230K
• Strong FHA and cash activity
• Faster decisions
• Entry-level and investor interest
$235K–$290K (Warner Robins’ center of gravity)
• Highest concentration of closings
• VA and conventional buyers dominant
• Predictable absorption
$300K+
• Active, but more deliberate
• Longer evaluation cycles
• Outcomes depend on condition and location
This distribution shows a market that absorbs volume best in the mid-$200s — a key stabilizer for 2026.
💳 Financing Mix: What Sustains the Market
| Loan Type | Homes Sold | Avg Price | Avg DOM |
|---|---|---|---|
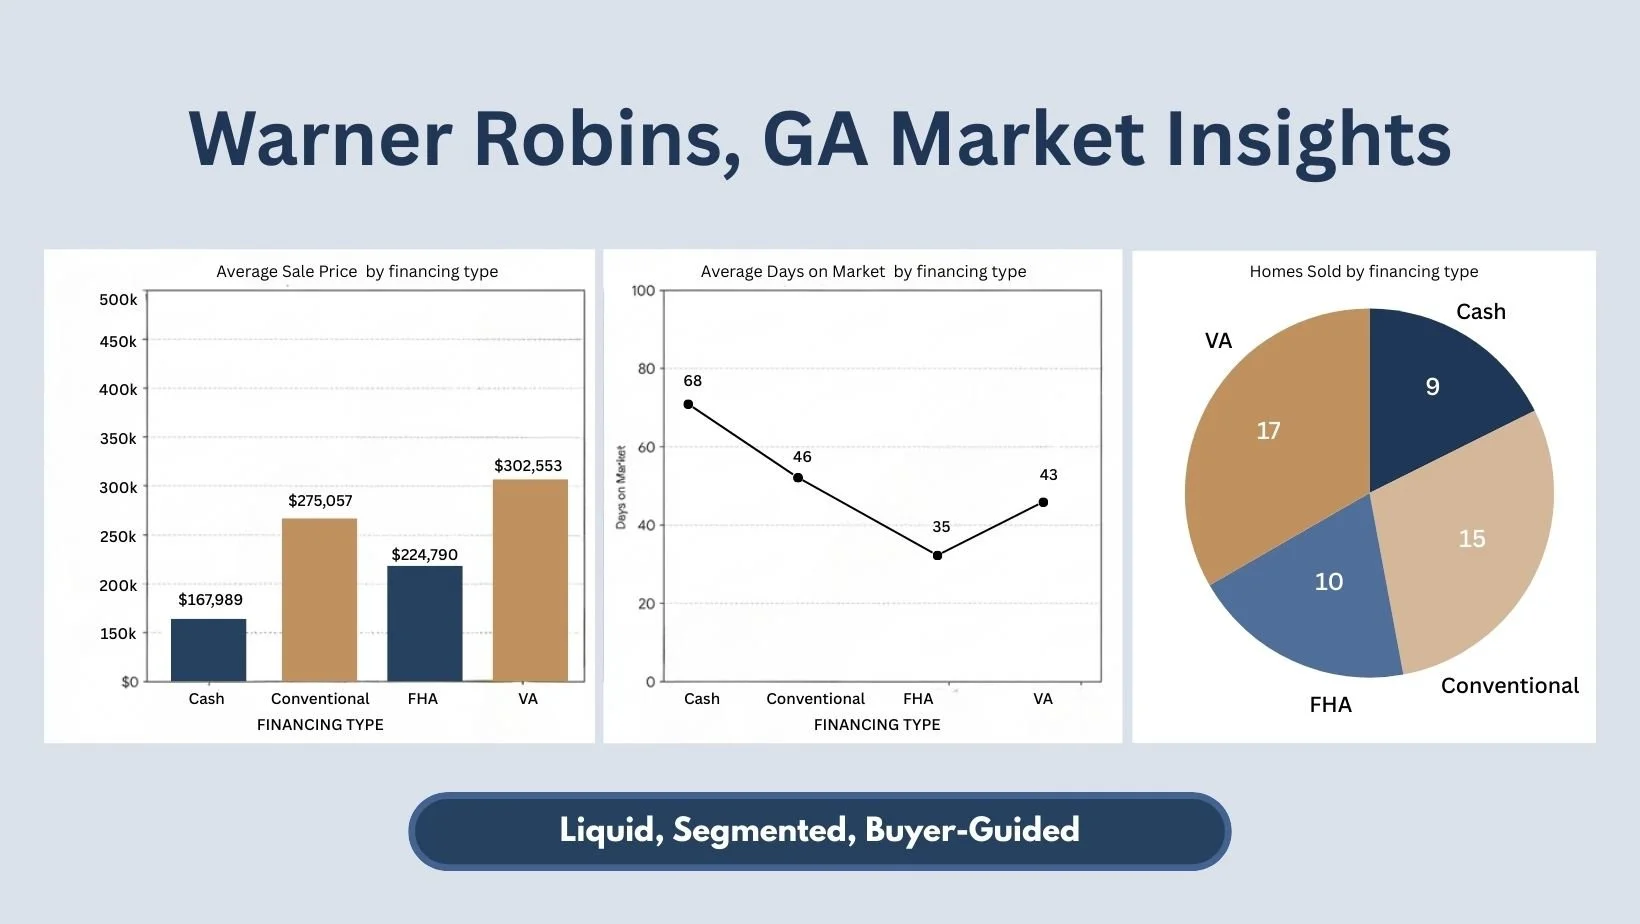
| VA | 17 | $302,553 | 43 |
| Conventional | 15 | $275,057 | 46 |
| FHA | 10 | $224,790 | 35 |
| Cash | 9 | $167,989 | 68 |
What this tells us:
• VA and conventional loans anchor the market, reflecting Robins Air Force Base influence and stable employment
• FHA remains active, especially in entry-level ranges
• Cash is present but not dominant, reinforcing price discipline
Warner Robins pricing continues to be validated through underwriting, not speculative pressure.
🧭 How the Market Behaved in January
Warner Robins in January felt:
• Liquid
• Organized
• Buyer-informed
• Location-sensitive
• Resistant to extremes
Homes didn’t sell because inventory was tight.
They sold because buyers knew exactly what they were looking for.
🕰 What This Signals for Warner Robins in 2026
January positions Warner Robins as a foundation market for the year ahead.
For Buyers:
• Choice remains an advantage
• The strongest competition stays in the mid-$200s
• Neighborhood selection matters more than timing
For Sellers:
• Correct neighborhood pricing drives outcomes
• Condition directly affects absorption speed
• Overreaching beyond your micro-market adds time, not value
For the Market Overall:
• Volume should remain consistent
• Pricing is likely to stay range-bound
• Warner Robins will continue to lead through stability, not spikes
🔎 The Takeaway
January didn’t surprise Warner Robins. It confirmed its role.
| Metric | January 2026 |
|---|---|
| Homes Sold | 52 |
| Median Sold Price | $236,000 |
| Median Active Price | $264,900 |
| Average Sold DOM | 46 |
| Market Profile | Liquid, Segmented, Buyer-Guided |
That profile is exactly what keeps large markets moving — even when conditions shift.
📞 Thinking About Your Next Move?
Whether you’re buying, selling, or evaluating where your home fits within Warner Robins’ many micro-markets, clarity matters more than averages. I’m here to help you break that down and move forward with confidence.
William Walton-Dean | Walton Dean Realty
📱 478-371-7069
Your dreams. Our dedication. A luxury experience tailored for you.